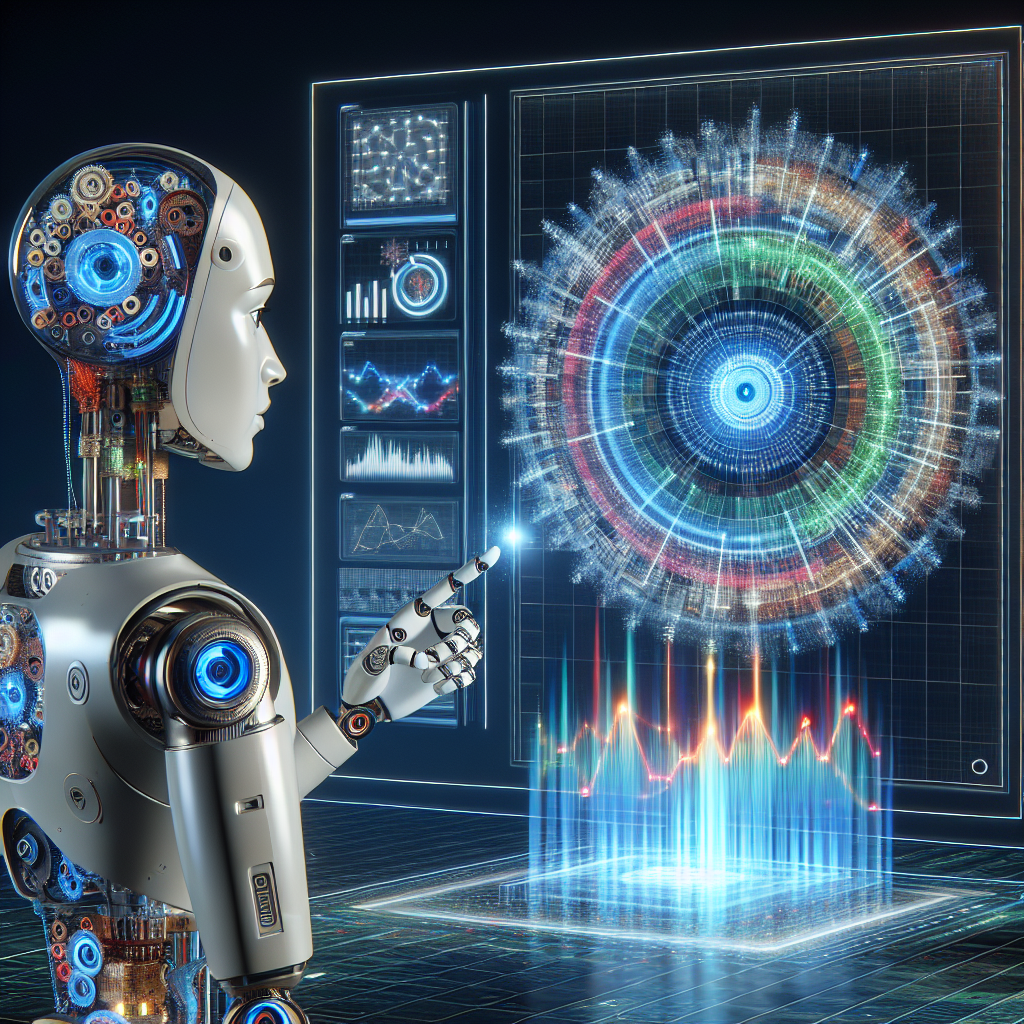
Data visualization is an essential tool for businesses and organizations to make sense of the vast amounts of data they collect. It allows them to uncover patterns, trends, and outliers that may not be immediately apparent when looking at raw data. However, the traditional methods of data visualization, such as charts and graphs, can be time-consuming and limited in their ability to convey complex information.
This is where artificial intelligence (AI) comes in. AI is revolutionizing data visualization by enabling businesses to create more sophisticated and interactive visualizations that can help them make better decisions and drive innovation. In this article, we will discuss how AI is transforming data visualization and its impact on businesses.
1. Automated Data Analysis
One of the key ways AI is revolutionizing data visualization is through automated data analysis. AI-powered tools can analyze large datasets quickly and accurately, allowing businesses to uncover insights that may have been missed using traditional methods. These tools can also identify patterns and trends in the data, making it easier for businesses to make informed decisions.
For example, AI-powered tools can analyze customer data to identify buying patterns and preferences. This information can then be used to create targeted marketing campaigns that are more likely to resonate with customers, leading to increased sales and customer satisfaction.
2. Interactive Visualizations
AI is also enabling businesses to create more interactive visualizations that allow users to explore data in new ways. For example, AI-powered tools can generate dynamic visualizations that update in real-time as new data is added. This allows users to drill down into the data and uncover insights that may not be immediately apparent.
Interactive visualizations can also help businesses communicate complex information more effectively. By allowing users to manipulate the data and explore different scenarios, businesses can ensure that their message is clear and easily understood.
3. Natural Language Processing
Another way AI is revolutionizing data visualization is through natural language processing (NLP). NLP allows users to interact with data using natural language commands, making it easier for non-technical users to explore and analyze data.
For example, users can ask AI-powered tools questions about the data, such as “What are the sales figures for Q3?” or “Show me a breakdown of customer demographics by region.” The tools can then generate visualizations that answer these questions, making it easier for users to uncover insights and make decisions.
4. Predictive Analytics
AI is also enabling businesses to use predictive analytics to forecast future trends and outcomes. By analyzing historical data and identifying patterns, AI-powered tools can predict future trends with a high degree of accuracy. These predictions can then be visualized using interactive tools, allowing businesses to make informed decisions based on future projections.
For example, AI-powered tools can analyze sales data to predict future demand for a product. Businesses can then use this information to adjust their inventory levels and marketing strategies, ensuring that they are prepared for future demand.
FAQs:
1. How is AI different from traditional data visualization tools?
AI-powered data visualization tools use advanced algorithms and machine learning techniques to analyze data and generate visualizations. These tools can automate the data analysis process, identify patterns and trends in the data, and create interactive visualizations that allow users to explore data in new ways.
In contrast, traditional data visualization tools rely on manual data analysis and static visualizations, such as charts and graphs. While these tools can be effective for basic data analysis, they are limited in their ability to handle large datasets and complex information.
2. What are the benefits of using AI-powered data visualization tools?
There are several benefits to using AI-powered data visualization tools, including:
– Faster and more accurate data analysis
– Ability to uncover insights and trends that may have been missed using traditional methods
– Creation of interactive visualizations that allow users to explore data in new ways
– Ability to predict future trends and outcomes using predictive analytics
– Improved communication of complex information to stakeholders
Overall, AI-powered data visualization tools can help businesses make better decisions, drive innovation, and stay ahead of the competition.
3. How can businesses get started with AI-powered data visualization?
Businesses can get started with AI-powered data visualization by investing in the right tools and technology. There are many AI-powered data visualization platforms available on the market, ranging from simple tools for small businesses to more advanced platforms for large enterprises.
Businesses should also invest in training for their employees to ensure they have the skills and knowledge needed to use AI-powered data visualization tools effectively. By investing in the right tools and training, businesses can harness the power of AI to revolutionize their data visualization efforts and drive business success.

